Margin of error
The latest poll before his withdrawal showed President Biden leading former President Trump in Arizona in the two-candidate race by 50.1% to 49.9% with a margin of error of 2.5%
is the form of a news lede often seen and it means that if the election were held at the time of the poll, those proportions of respondents indicate their preferences for the respective candidates. The margin of error provides the additional information that the respondents were selected at random and indicates how much the response varies from what could be found if everyone, and not just the sample, were asked. So, while the proportion of voters in the sample favoring Harris is exactly 50.1%, the proportion of all voters could be larger or smaller—47.6% to 52.6%. Because the margin for Trump overlaps—47.4% to 52.4%. This is often referred to as a "statistical dead heat."
That is an over-simplification because there are two principal sources of error that can be estimated at the time of survey.
One is called "design error," which arises from taking information gained from the voters being surveyed in addition to voting preference, such as age, gender, ethnicity, etc. This information is used to weight responses. If only 42.12% of the respondends identified as female, for example, and 50.01% of the population is, according to the latest demographic information, the proportion in the population, the lower number would be scaled up. This is sometimes reported explicitly, but often is not or is rolled into the other type of margin of error.
The second is simple random sampling error. This arises simply from the math. It depends strictly on the number of random samples taken, often referred to as \(N\).
| Confidence level | Required sample | \Margin of error |
|---|---|---|
| 99.00% | 2,165 | 1% |
| 97.50% | 1,537 | 2.5% |
| 95.00% | 1,083 | 5% |
| 90.00% | 657 | 10% |
| 80.00% | 284 | 20% |
A margin of error is the probability of being wrong about the population. A dramatic way to think of it is in terms of Russian roullette. Imagine a 5-shot revolver on the table that has two cartridges. The drunken Russian holding it to his head has a 2 in 5 chance of blowing out his brains. If he is given a choice of two revolvers with only a single cartridge, that drops to 1 in 10. Four revolvers similarly is 1 in 20. Ten revolvers is 1 in 100.
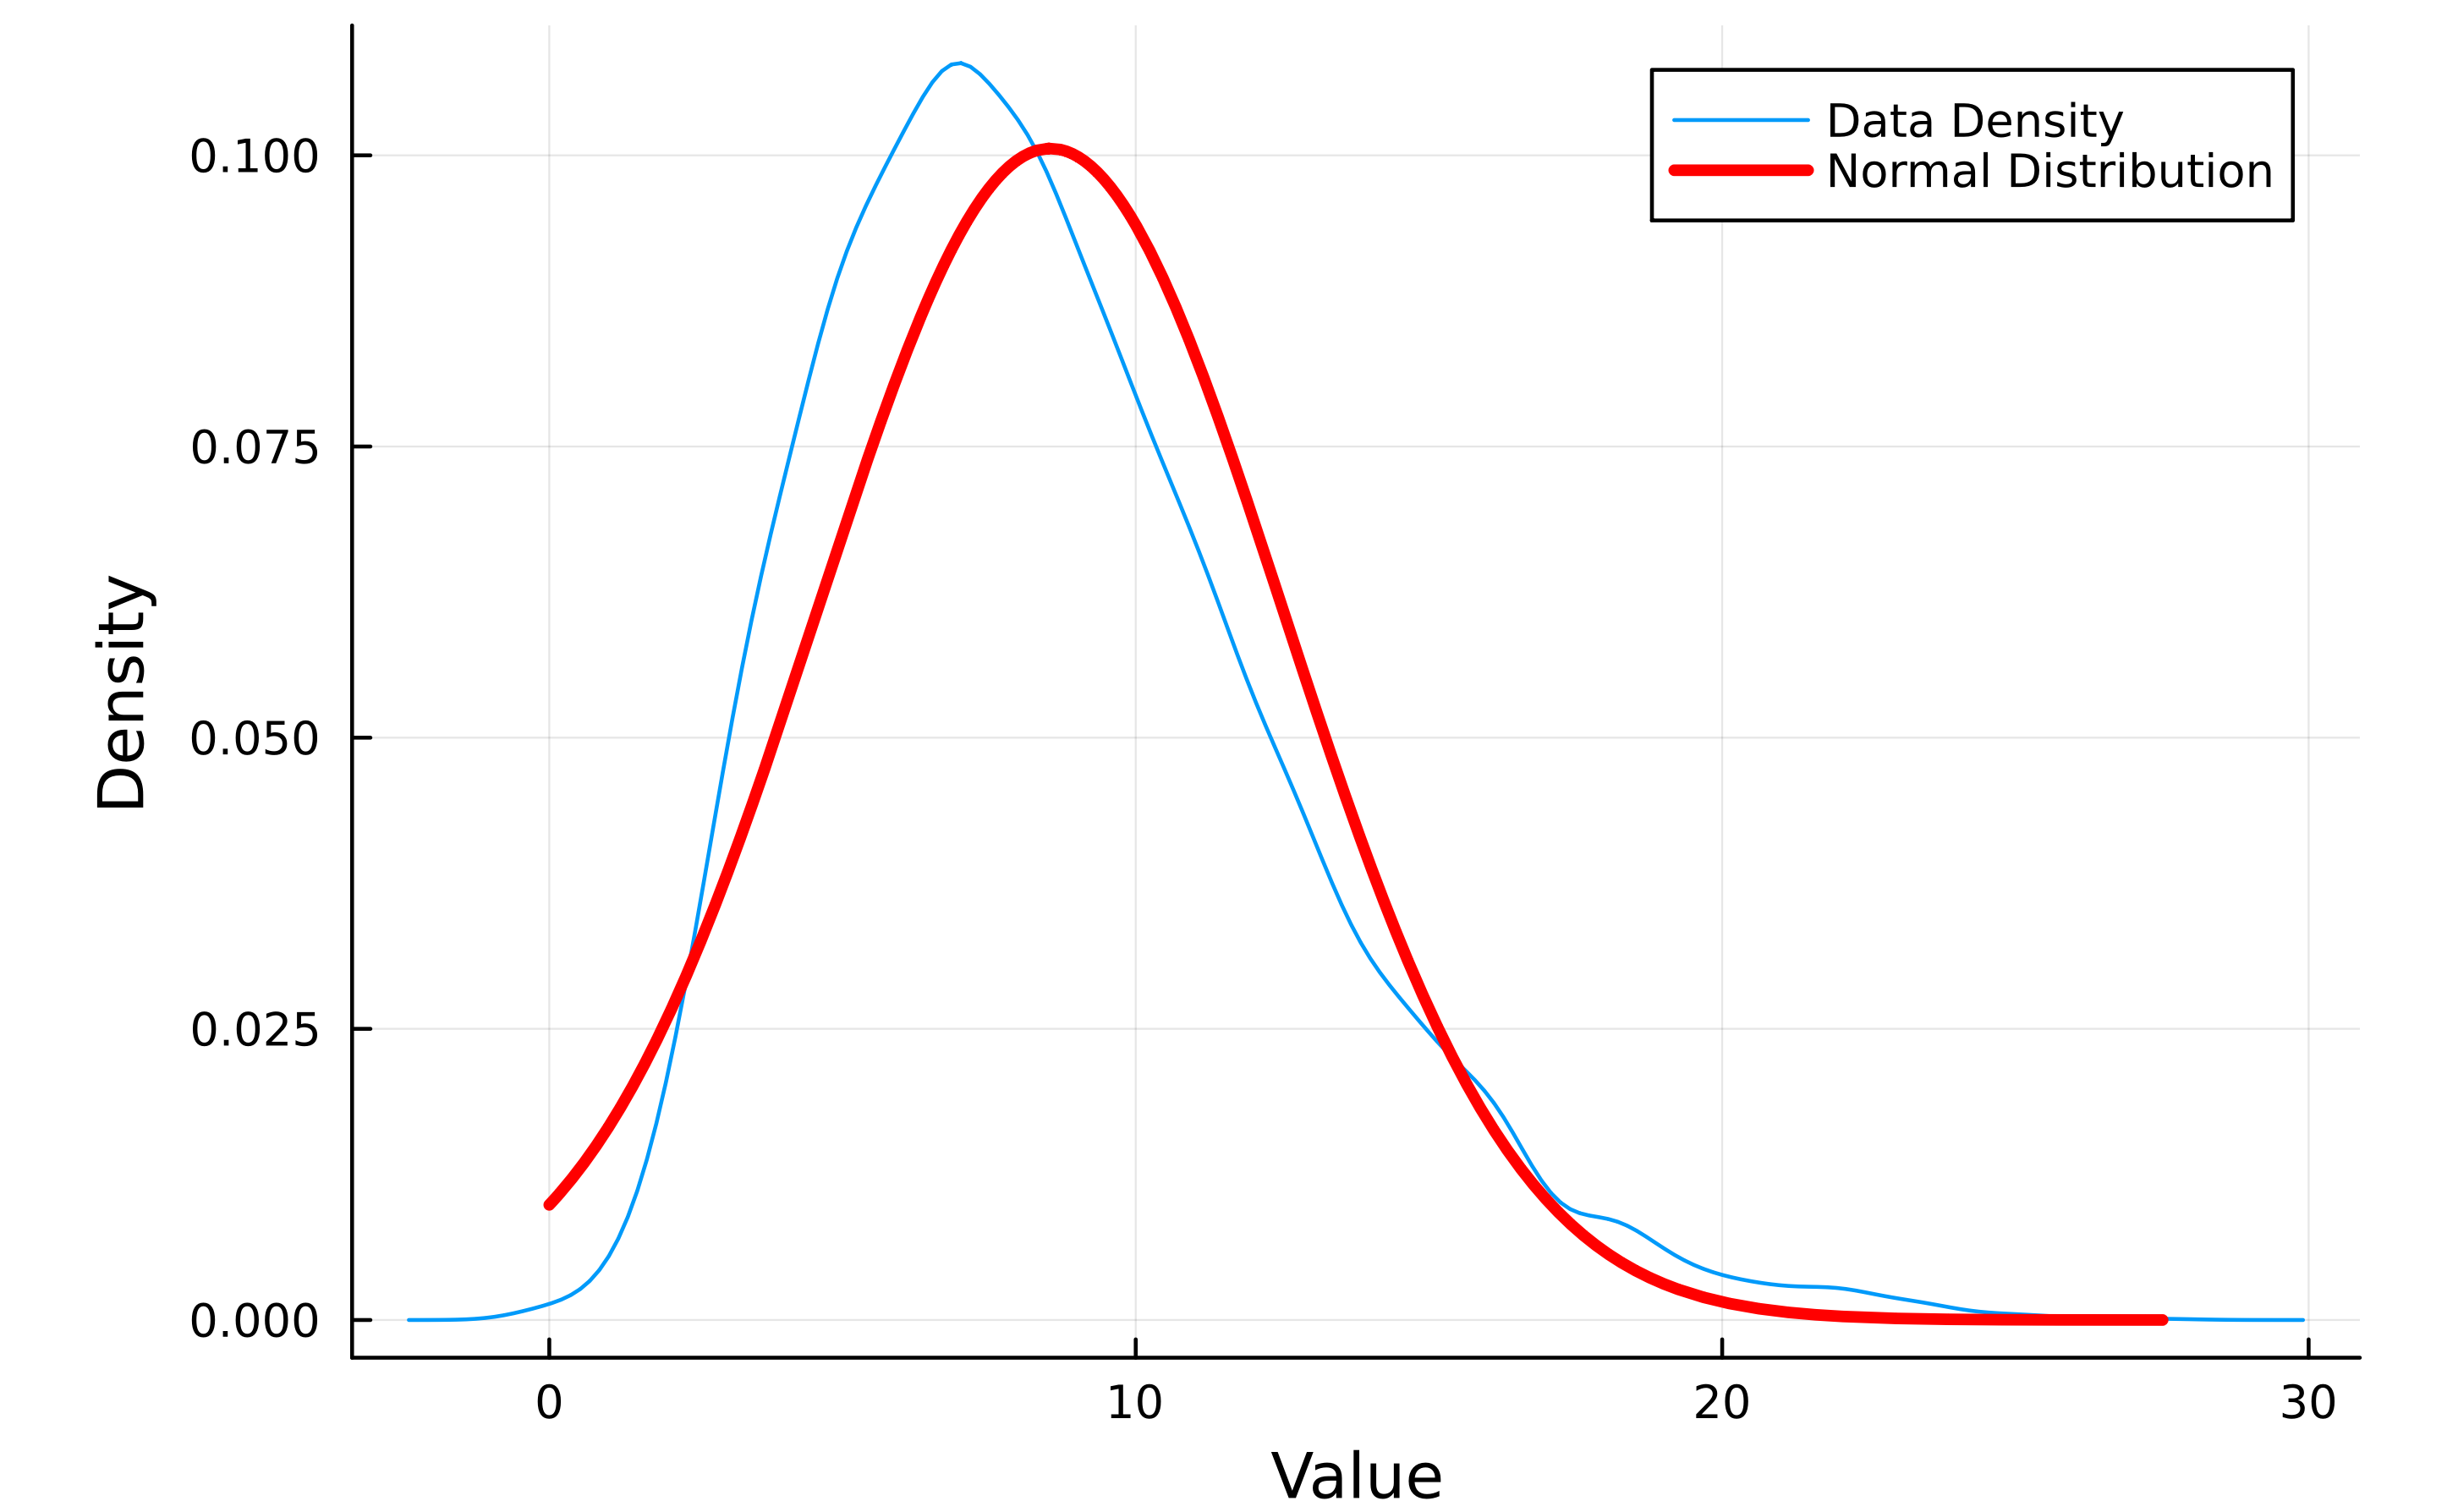
Random sampling derives it power from mathematical properties, not from the real world. There is little in the real world directly experienced in daily life that is truly random. Life is more organized than that. What's more, randomness itself, is chock full of patterns. However, a random sample has useful properties. It may, with only a relatively few draws have a normal distribution even if the population is is drawn from does not.
So, the well known regularities of the normal distribution, the Gaussian distribution or what is called the bell curve are properties of abstraction, not of the underlying reality.
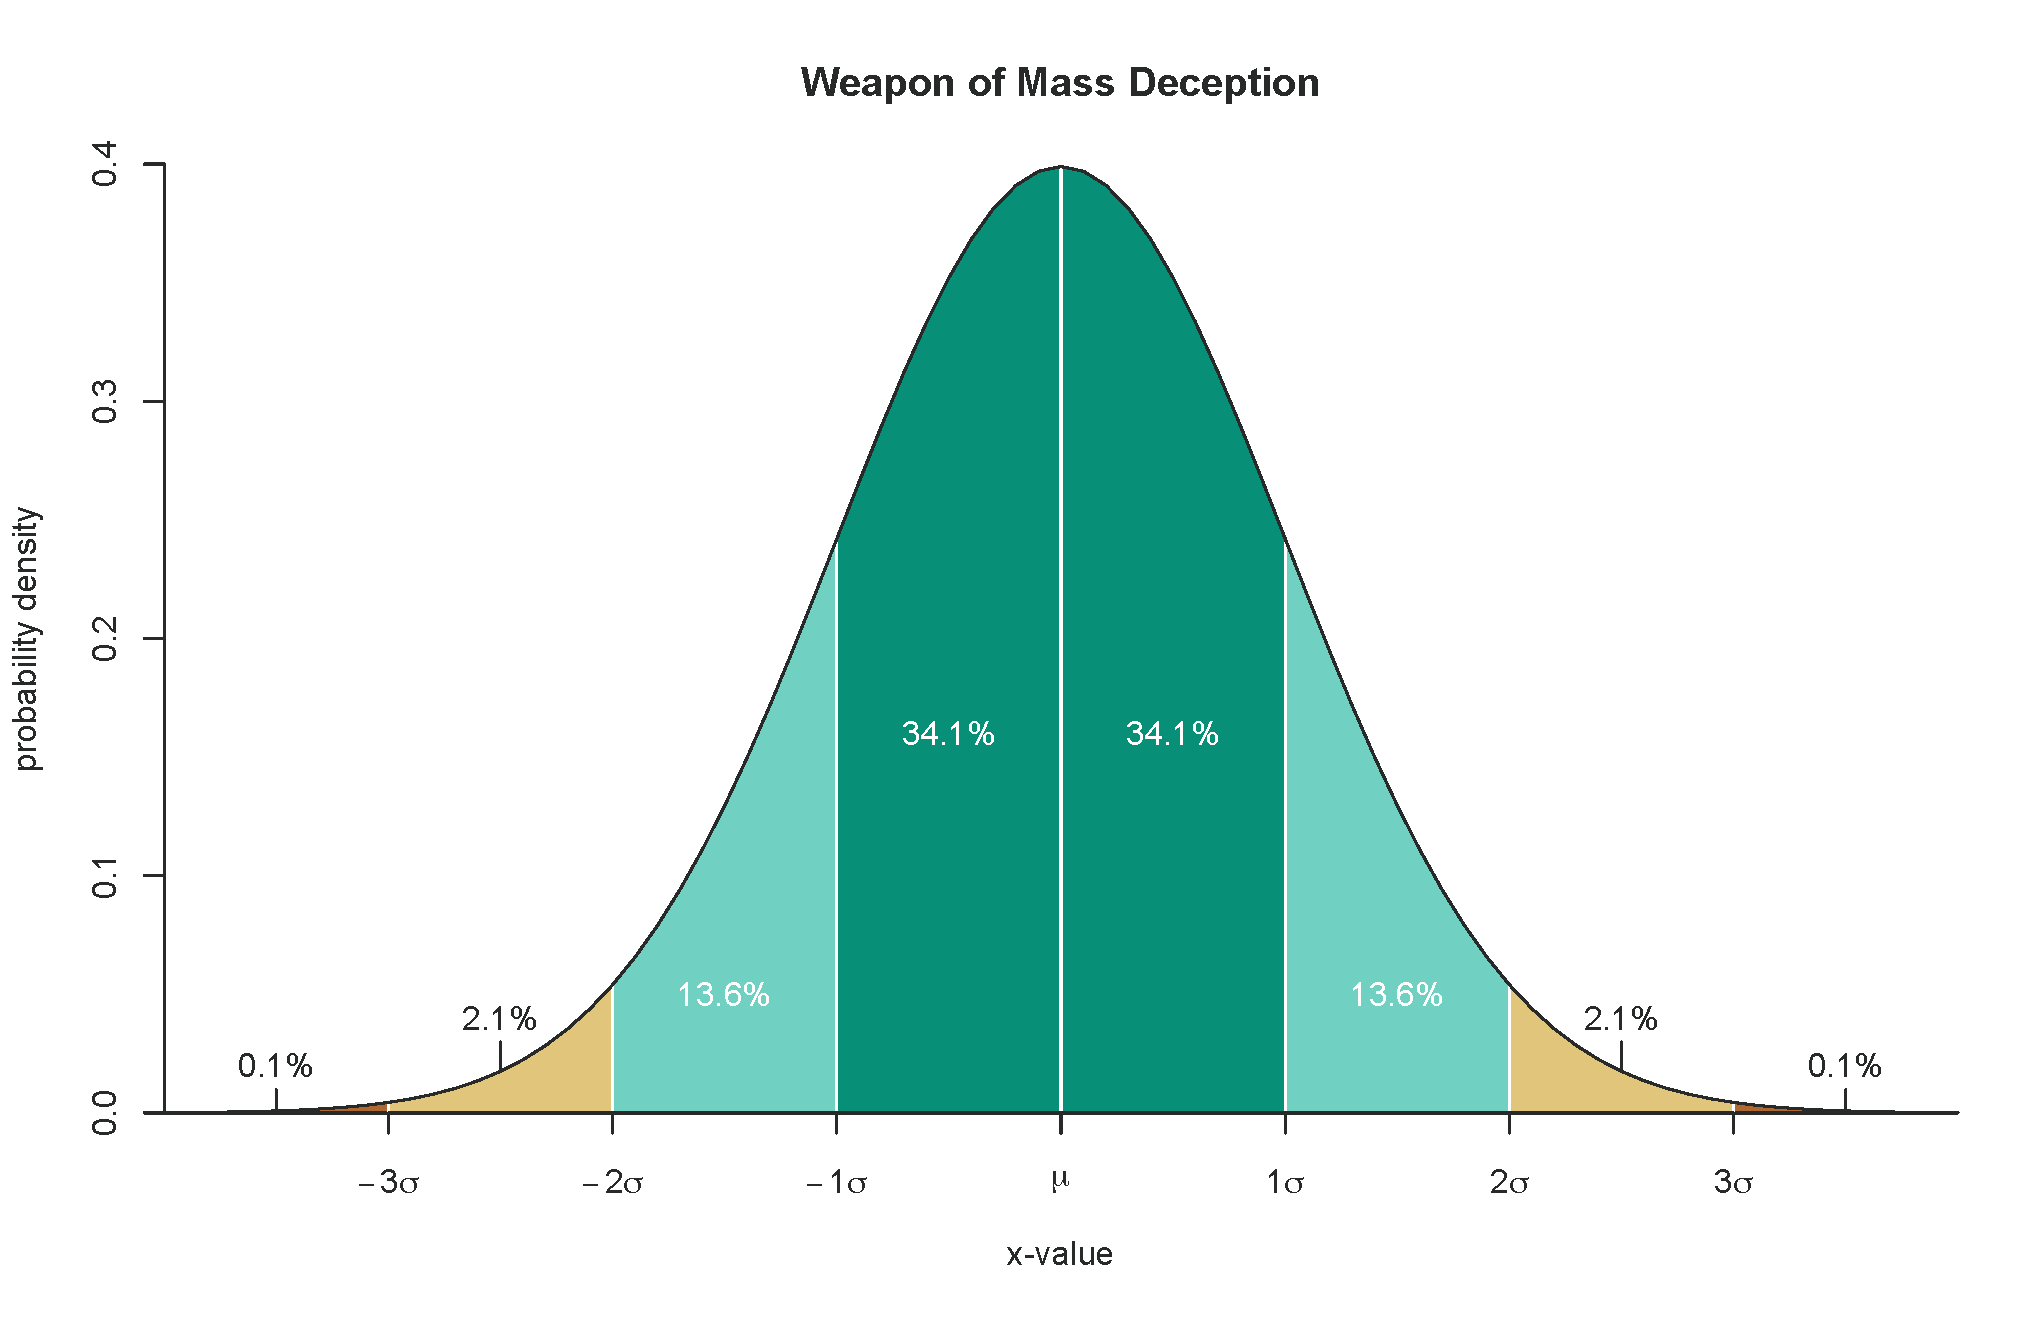
A margin of error of a sample is constructed by considering a measure of central tendendcy, the mean and a measure of variability, the standard deviation. Those interact to produce the table above. If you see poll results reported with a margin of error but not an \(N\), it can be interpolated to \(N\) using the table above.
Unless there is a specific reason, most readers have no need to do the calculations themselves. For the curious, however, formulas follow.
\(\text{Margin of Error} = z \times \sqrt{\frac{p(1-p)}{n}}\)where
zis the z-score corresponding to the desired confidence levelpis the sample proportion (or assumed population proportion)nis the sample size
The z-score, in turn, is \(z = \frac{\bar{x} - \mu}{\frac{\sigma}{\sqrt{n}}}\)
where
\(\bar{x}\) is the sample mean \(\mu\) is the population mean \(\sigma\) is the population standard deviation \(n\) is the sample size
The term \(\frac{\sigma}{\sqrt{n}}\) represents the standard error of the mean, which is the standard deviation of the sampling distribution of the mean.
The z-score measures the number of standard deviations an individual value or sample mean is away from the population mean.