North Carolina
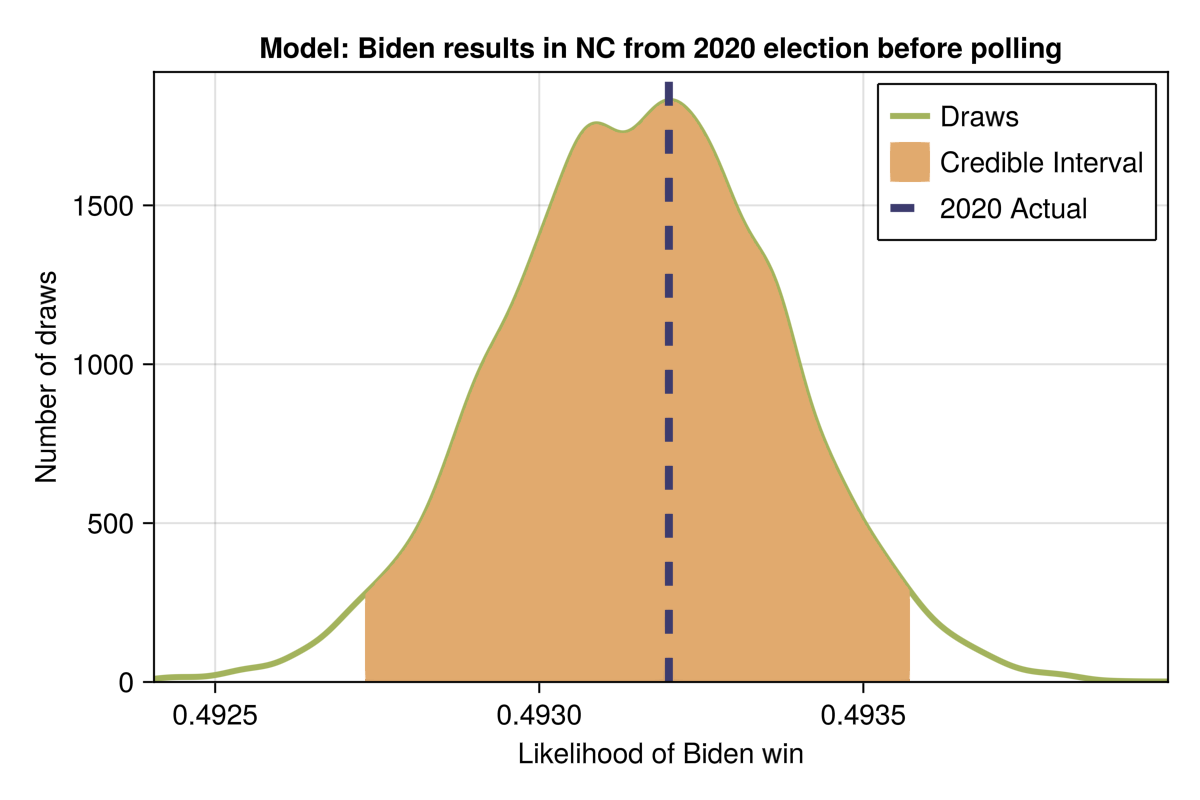
In the 2020 election President Biden won 49.32% (0.4942) of the votes cast for Biden or Trump in North Carolina. This leaves out votes for third-party candidates. Taking the actual result as a starting point, the model introduces some uncertainty into the result to create a range of outcomes for that election from 50.08% to 50.16%, . Next, the results of each month's polling is factored in on a rolling basis
Assessments are based on three criteria.
Stringent—Harris wins if all of the values in the credible interval (analogous to the confidence interval) are equal to or greater than his 2020 margin.
Historical—fewer than 2.5% of the values in the credible interval are less than 2020 margin.
Relaxed—fewer than 2.5% of the values in the credible interval are less than 50.01% of the two candidate vote.
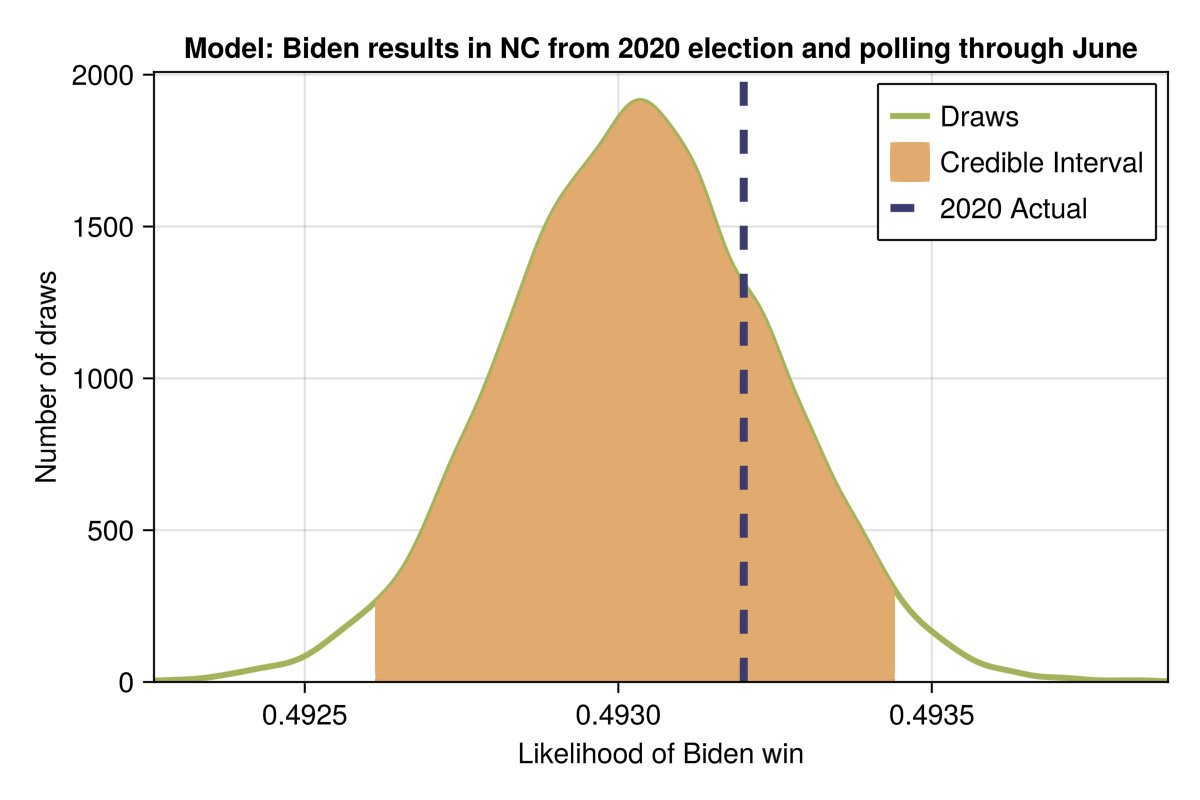
June assessment
A Harris victory is not within the credible interval under any of the scenarios.
| median | mean | mode | q025 | q975 | mcse | rhat |
|---|---|---|---|---|---|---|
| 0.493 | 0.493 | 0.493 | 0.4926 | 0.4934 | 0.0 | 1.0002 |
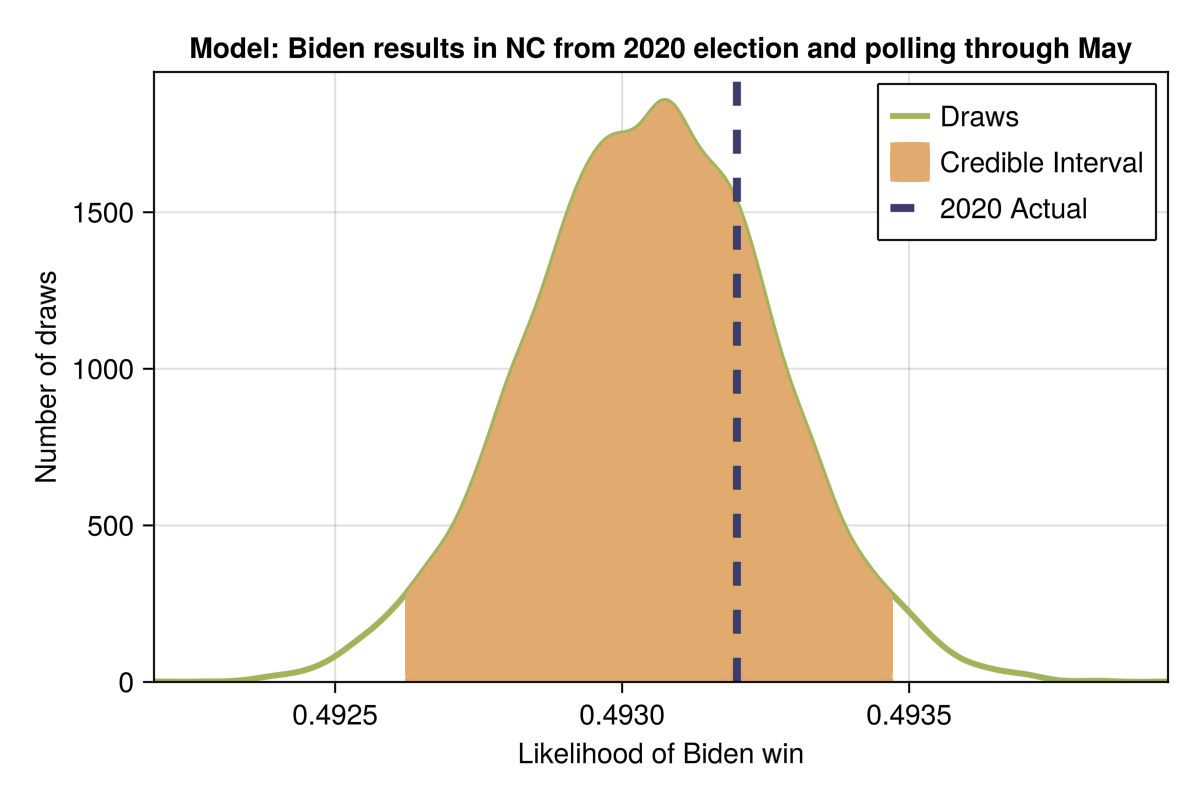
May assessment
A Harris victory is not within the credible interval under any of the scenarios.
| median | mean | mode | q025 | q975 | mcse | rhat |
|---|---|---|---|---|---|---|
| 0.493 | 0.493 | 0.4929 | 0.4926 | 0.4935 | 0.0 | 1.0 |
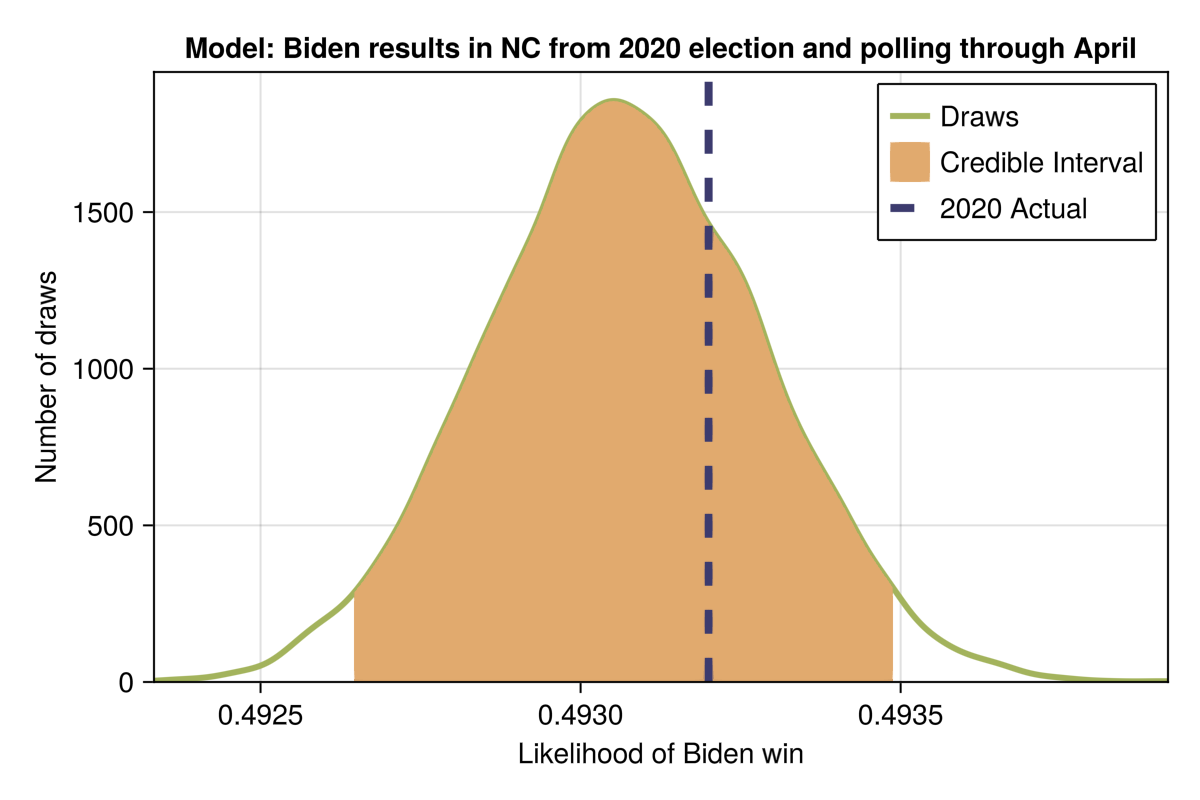
April assessment
A Harris victory is not within the credible interval under any of the scenarios.
| median | mean | mode | q025 | q975 | mcse | rhat |
|---|---|---|---|---|---|---|
| 0.4932 | 0.4932 | 0.4933 | 0.4927 | 0.4936 | 0.0 | 1.0001 |
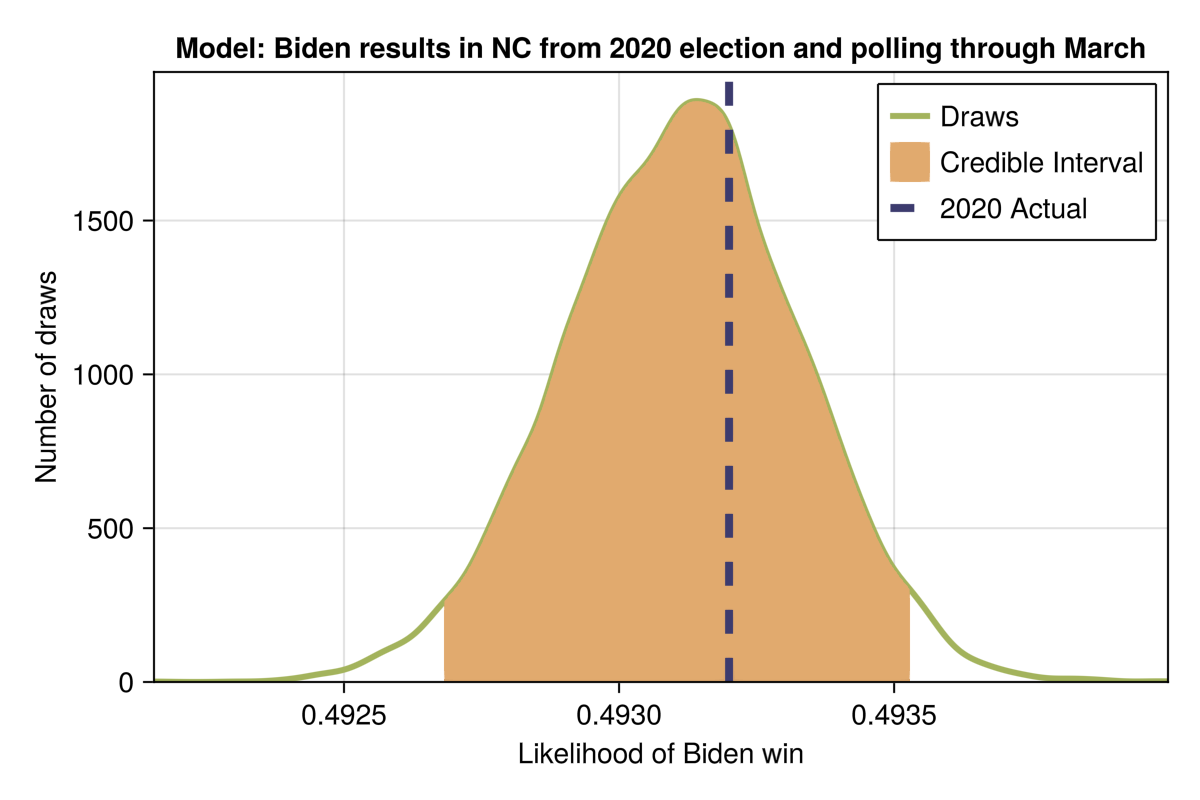
March assessment
A Harris victory is not within the credible interval under any of the scenarios.
| median | mean | mode | q025 | q975 | mcse | rhat |
|---|---|---|---|---|---|---|
| 0.4931 | 0.4931 | 0.4929 | 0.4926 | 0.4935 | 0.0 | 1.0004 |
2020 election
| median | mean | mode | q025 | q975 | mcse | rhat |
|---|---|---|---|---|---|---|
| 0.4932 | 0.4932 | 0.4932 | 0.4927 | 0.4936 | 0.0 | 0.9999 |
Harris wins
| States won by Harris | Electoral Votes | Harris Votes | Trump Votes | Result |
|---|---|---|---|---|
| WI, PA and NC | 45 | 270 | 268 | Harris |
| AZ, PA and NC | 46 | 271 | 267 | Harris |
| NV, WI, MI and NC | 47 | 272 | 266 | Harris |
| GA, MI and NC | 47 | 272 | 266 | Harris |
| NV, WI, GA and NC | 48 | 273 | 265 | Harris |
| NV, AZ, MI and NC | 48 | 273 | 265 | Harris |
| NV, AZ, GA and NC | 49 | 274 | 264 | Harris |
| MI, PA and NC | 50 | 275 | 263 | Harris |
| NV, WI, PA and NC | 51 | 276 | 262 | Harris |
| GA, PA and NC | 51 | 276 | 262 | Harris |
| NV, AZ, PA and NC | 52 | 277 | 261 | Harris |
| WI, AZ, MI and NC | 52 | 277 | 261 | Harris |
| NV, GA, MI and NC | 53 | 278 | 260 | Harris |
| WI, AZ, GA and NC | 53 | 278 | 260 | Harris |
| NV, MI, PA and NC | 56 | 281 | 257 | Harris |
| WI, AZ, PA and NC | 56 | 281 | 257 | Harris |
| NV, GA, PA and NC | 57 | 282 | 256 | Harris |
| WI, GA, MI and NC | 57 | 282 | 256 | Harris |
| NV, WI, AZ, MI and NC | 58 | 283 | 255 | Harris |
| AZ, GA, MI and NC | 58 | 283 | 255 | Harris |
| NV, WI, AZ, GA and NC | 59 | 284 | 254 | Harris |
| WI, MI, PA and NC | 60 | 285 | 253 | Harris |
| WI, GA, PA and NC | 61 | 286 | 252 | Harris |
| AZ, MI, PA and NC | 61 | 286 | 252 | Harris |
| NV, WI, AZ, PA and NC | 62 | 287 | 251 | Harris |
| AZ, GA, PA and NC | 62 | 287 | 251 | Harris |
| NV, WI, GA, MI and NC | 63 | 288 | 250 | Harris |
| NV, AZ, GA, MI and NC | 64 | 289 | 249 | Harris |
| NV, WI, MI, PA and NC | 66 | 291 | 247 | Harris |
| GA, MI, PA and NC | 66 | 291 | 247 | Harris |
| NV, WI, GA, PA and NC | 67 | 292 | 246 | Harris |
| NV, AZ, MI, PA and NC | 67 | 292 | 246 | Harris |
| NV, AZ, GA, PA and NC | 68 | 293 | 245 | Harris |
| WI, AZ, GA, MI and NC | 68 | 293 | 245 | Harris |
| WI, AZ, MI, PA and NC | 71 | 296 | 242 | Harris |
| NV, GA, MI, PA and NC | 72 | 297 | 241 | Harris |
| WI, AZ, GA, PA and NC | 72 | 297 | 241 | Harris |
| NV, WI, AZ, GA, MI and NC | 74 | 299 | 239 | Harris |
| WI, GA, MI, PA and NC | 76 | 301 | 237 | Harris |
| AZ, GA, MI, PA and NC | 77 | 302 | 236 | Harris |
| NV, WI, AZ, MI, PA and NC | 77 | 302 | 236 | Harris |
| NV, WI, AZ, GA, PA and NC | 78 | 303 | 235 | Harris |
| NV, WI, GA, MI, PA and NC | 82 | 307 | 231 | Harris |
| NV, AZ, GA, MI, PA and NC | 83 | 308 | 230 | Harris |
| WI, AZ, GA, MI, PA and NC | 87 | 312 | 226 | Harris |
| NV, WI, AZ, GA, MI, PA and NC | 93 | 318 | 220 | Harris |
Trump wins
| States won by Harris | Electoral Votes | Harris Votes | Trump Votes | Result |
|---|---|---|---|---|
| NC | 16 | 241 | 297 | Trump |
| NV and NC | 22 | 247 | 291 | Trump |
| WI and NC | 26 | 251 | 287 | Trump |
| AZ and NC | 27 | 252 | 286 | Trump |
| MI and NC | 31 | 256 | 282 | Trump |
| GA and NC | 32 | 257 | 281 | Trump |
| NV, WI and NC | 32 | 257 | 281 | Trump |
| NV, AZ and NC | 33 | 258 | 280 | Trump |
| PA and NC | 35 | 260 | 278 | Trump |
| NV, MI and NC | 37 | 262 | 276 | Trump |
| WI, AZ and NC | 37 | 262 | 276 | Trump |
| NV, GA and NC | 38 | 263 | 275 | Trump |
| NV, PA and NC | 41 | 266 | 272 | Trump |
| WI, MI and NC | 41 | 266 | 272 | Trump |
| WI, GA and NC | 42 | 267 | 271 | Trump |
| AZ, MI and NC | 42 | 267 | 271 | Trump |
| NV, WI, AZ and NC | 43 | 268 | 270 | Trump |
| AZ, GA and NC | 43 | 268 | 270 | Trump |
Harris wins without North Carolina
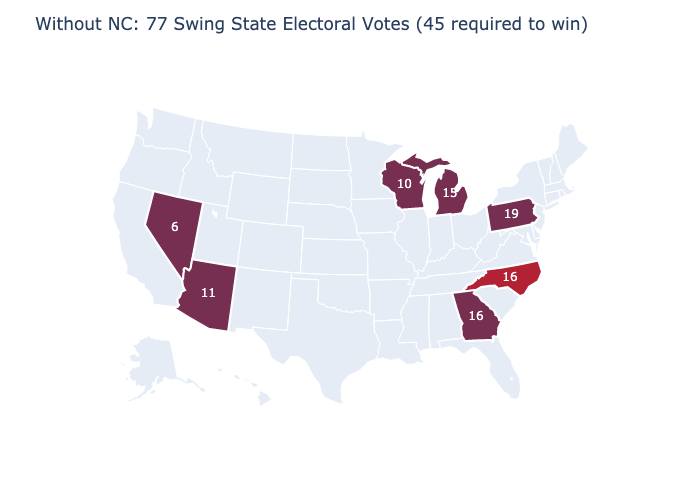
| States won by Harris | Electoral Votes | Harris Votes | Trump Votes | Result |
|---|---|---|---|---|
| WI, GA and PA | 45 | 270 | 268 | Harris |
| AZ, MI and PA | 45 | 270 | 268 | Harris |
| NV, WI, AZ and PA | 46 | 271 | 267 | Harris |
| AZ, GA and PA | 46 | 271 | 267 | Harris |
| NV, WI, GA and MI | 47 | 272 | 266 | Harris |
| NV, AZ, GA and MI | 48 | 273 | 265 | Harris |
| NV, WI, MI and PA | 50 | 275 | 263 | Harris |
| GA, MI and PA | 50 | 275 | 263 | Harris |
| NV, WI, GA and PA | 51 | 276 | 262 | Harris |
| NV, AZ, MI and PA | 51 | 276 | 262 | Harris |
| NV, AZ, GA and PA | 52 | 277 | 261 | Harris |
| WI, AZ, GA and MI | 52 | 277 | 261 | Harris |
| WI, AZ, MI and PA | 55 | 280 | 258 | Harris |
| NV, GA, MI and PA | 56 | 281 | 257 | Harris |
| WI, AZ, GA and PA | 56 | 281 | 257 | Harris |
| NV, WI, AZ, GA and MI | 58 | 283 | 255 | Harris |
| WI, GA, MI and PA | 60 | 285 | 253 | Harris |
| NV, WI, AZ, MI and PA | 61 | 286 | 252 | Harris |
| AZ, GA, MI and PA | 61 | 286 | 252 | Harris |
| NV, WI, AZ, GA and PA | 62 | 287 | 251 | Harris |
| NV, WI, GA, MI and PA | 66 | 291 | 247 | Harris |
| NV, AZ, GA, MI and PA | 67 | 292 | 246 | Harris |
| WI, AZ, GA, MI and PA | 71 | 296 | 242 | Harris |
| NV, WI, AZ, GA, MI and PA | 77 | 302 | 236 | Harris |
State facts
Electoral votes: 16
2020: Trump
2016: Trump
2020 turnout: 5,443,067
2020 margin: 74,483
2022 turnout (Senate): 3,689,835
Governor: Roy Cooper (D)
Senator up for election: None
Senate: R (2)
House: D (7) R (7)
State House: R (72) D (48)
State House 2024 election: All seats
State Senate: R (30) D (20)
State Senate 2024 election: All seats
Secretary of State: North Carolina State Board of Elections (NCSBE) D(3) R(2)
Polls close: 7:30 pm Eastern
Mail-in voting: Yes
Early in-person voting: Yes
State demographics
| Label (GROUPING) | NC |
|---|---|
| TOTAL NUMBER OF RACES REPORTED | |
| Total population | 10,698,973 |
| One race | 92.1% |
| Two races | 7.4% |
| Three races | 0.5% |
| Four or more races | 0.1% |
| SEX AND AGE | |
| Total population | 10,698,973 |
| Male | 48.9% |
| Female | 51.1% |
| Under 5 years | 5.5% |
| 5 to 17 years | 16.0% |
| 18 to 24 years | 9.7% |
| 25 to 34 years | 13.3% |
| 35 to 44 years | 12.9% |
| 45 to 54 years | 12.6% |
| 55 to 64 years | 12.7% |
| 65 to 74 years | 10.4% |
| 75 years and over | 7.0% |
| Median age (years) | 39.2 |
| 18 years and over | 78.6% |
| 21 years and over | 74.4% |
| 62 years and over | 21.4% |
| 65 years and over | 17.4% |
| Under 18 years | 2,292,928 |
| Male | 51.2% |
| Female | 48.8% |
| 18 years and over | 8,406,045 |
| Male | 48.3% |
| Female | 51.7% |
| 18 to 34 years | 2,454,354 |
| Male | 50.3% |
| Female | 49.7% |
| 35 to 64 years | 4,085,077 |
| Male | 49.0% |
| Female | 51.0% |
| 65 years and over | 1,866,614 |
| Male | 44.0% |
| Female | 56.0% |
| RELATIONSHIP | |
| Population in households | 10,417,729 |
| Householder or spouse | 61.0% |
| Unmarried partner | 2.6% |
| Child | 27.6% |
| Other relatives | 6.1% |
| Other nonrelatives | 2.7% |
| HOUSEHOLDS BY TYPE | |
| Households | 4,299,266 |
| Family households | 64.8% |
| With own children of the householder under 18 years | 25.9% |
| Married-couple family | 47.9% |
| With own children of the householder under 18 years | 17.3% |
| Female householder, no spouse present, family | 12.5% |
| With own children of the householder under 18 years | 6.6% |
| Nonfamily households | 35.2% |
| Male householder | 15.7% |
| Living alone | 12.4% |
| Not living alone | 3.3% |
| Female householder | 19.5% |
| Living alone | 16.4% |
| Not living alone | 3.0% |
| Average household size | 2.42 |
| Average family size | 3.00 |
| MARITAL STATUS | |
| Population 15 years and over | 8,814,897 |
| Now married, except separated | 49.5% |
| Widowed | 5.7% |
| Divorced | 10.3% |
| Separated | 2.1% |
| Never married | 32.4% |
| Male 15 years and over | 4,267,986 |
| Now married, except separated | 51.9% |
| Widowed | 2.8% |
| Divorced | 8.5% |
| Separated | 1.9% |
| Never married | 34.9% |
| Female 15 years and over | 4,546,911 |
| Now married, except separated | 47.3% |
| Widowed | 8.5% |
| Divorced | 11.9% |
| Separated | 2.3% |
| Never married | 30.1% |
| SCHOOL ENROLLMENT | |
| Population 3 years and over enrolled in school | 2,483,789 |
| Nursery school, preschool | 5.3% |
| Kindergarten | 5.0% |
| Elementary school (grades 1-8) | 41.1% |
| High school (grades 9-12) | 22.0% |
| College or graduate school | 26.6% |
| Male 3 years and over enrolled in school | 1,222,590 |
| Percent enrolled in kindergarten to grade 12 | 71.3% |
| Percent enrolled in college or graduate school | 23.1% |
| Female 3 years and over enrolled in school | 1,261,199 |
| Percent enrolled in kindergarten to grade 12 | 64.9% |
| Percent enrolled in college or graduate school | 30.1% |
| EDUCATIONAL ATTAINMENT | |
| Population 25 years and over | 7,372,120 |
| Less than high school diploma | 9.8% |
| High school graduate (includes equivalency) | 24.9% |
| Some college or associate's degree | 29.4% |
| Bachelor's degree | 22.8% |
| Graduate or professional degree | 13.2% |
| High school graduate or higher | 90.2% |
| Male, high school graduate or higher | 88.8% |
| Female, high school graduate or higher | 91.4% |
| Bachelor's degree or higher | 35.9% |
| Male, bachelor's degree or higher | 34.2% |
| Female, bachelor's degree or higher | 37.5% |
| FERTILITY | |
| Women 15 to 50 years | 2,518,824 |
| Women 15 to 50 years who had a birth in the past 12 months | 129,267 |
| Unmarried women 15 to 50 years who had a birth in the past 12 months | 42,336 |
| As a percent of all women with a birth in the past 12 months | 32.8% |
| RESPONSIBILITY FOR GRANDCHILDREN UNDER 18 YEARS | |
| Population 30 years and over | 6,677,445 |
| Grandparents living with grandchild(ren) | 2.9% |
| Grandparents responsible for grandchildren as a percentage of living with grandchildren | 41.6% |
| VETERAN STATUS | |
| Civilian population 18 years and over | 8,294,906 |
| Civilian veteran | 7.5% |
| DISABILITY STATUS | |
| Total civilian noninstitutionalized population | 10,480,843 |
| With a disability | 13.7% |
| Civilian noninstitutionalized population under 18 years | 2,290,759 |
| With a disability | 4.6% |
| Civilian noninstitutionalized population 18 to 64 years | 6,365,446 |
| With a disability | 11.4% |
| Civilian noninstitutionalized population 65 years and older | 1,824,638 |
| With a disability | 33.3% |
| RESIDENCE 1 YEAR AGO | |
| Population 1 year and over | 10,588,557 |
| Same house | 87.3% |
| Different house in the U.S. | 12.2% |
| Same county | 5.2% |
| Different county | 6.9% |
| Same state | 3.7% |
| Different state | 3.2% |
| Abroad | 0.6% |
| PLACE OF BIRTH, CITIZENSHIP STATUS AND YEAR OF ENTRY | |
| Native | 9,782,186 |
| Male | 48.8% |
| Female | 51.2% |
| Foreign born | 916,787 |
| Male | 49.5% |
| Female | 50.5% |
| Foreign born; naturalized U.S. citizen | 404,205 |
| Male | 47.3% |
| Female | 52.7% |
| Foreign born; not a U.S. citizen | 512,582 |
| Male | 51.2% |
| Female | 48.8% |
| Population born outside the United States | 916,787 |
| Entered 2010 or later | 35.9% |
| Entered 2000 to 2009 | 26.6% |
| Entered before 2000 | 37.6% |
| WORLD REGION OF BIRTH OF FOREIGN BORN | |
| Foreign-born population excluding population born at sea | 916,787 |
| Europe | 12.0% |
| Asia | 28.0% |
| Africa | 8.3% |
| Oceania | 0.4% |
| Latin America | 49.1% |
| Northern America | 2.2% |
| LANGUAGE SPOKEN AT HOME AND ABILITY TO SPEAK ENGLISH | |
| Population 5 years and over | 10,114,481 |
| English only | 87.3% |
| Language other than English | 12.7% |
| Speak English less than "very well" | 4.8% |
| EMPLOYMENT STATUS | |
| Population 16 years and over | 8,671,939 |
| In labor force | 62.8% |
| Civilian labor force | 61.5% |
| Employed | 59.2% |
| Unemployed | 2.3% |
| Unemployment Rate | 3.8% |
| Armed Forces | 1.3% |
| Not in labor force | 37.2% |
| Females 16 years and over | 4,477,069 |
| In labor force | 58.1% |
| Civilian labor force | 57.8% |
| Employed | 55.6% |
| Unemployed | 2.2% |
| Unemployment Rate | 3.8% |
| COMMUTING TO WORK | |
| Workers 16 years and over | 5,130,773 |
| Car, truck, or van - drove alone | 71.2% |
| Car, truck, or van - carpooled | 8.5% |
| Public transportation (excluding taxicab) | 0.5% |
| Walked | 1.6% |
| Other means | 1.4% |
| Worked from home | 16.8% |
| Mean travel time to work (minutes) | 25.1 |
| OCCUPATION | |
| Civilian employed population 16 years and over | 5,135,307 |
| Management, business, science, and arts occupations | 42.0% |
| Service occupations | 15.3% |
| Sales and office occupations | 19.9% |
| Natural resources, construction, and maintenance occupations | 8.7% |
| Production, transportation, and material moving occupations | 14.1% |
| Male civilian employed population 16 years and over | 2,646,717 |
| Management, business, science, and arts occupations | 37.1% |
| Service occupations | 12.8% |
| Sales and office occupations | 14.2% |
| Natural resources, construction, and maintenance occupations | 15.9% |
| Production, transportation, and material moving occupations | 20.0% |
| Female civilian employed population 16 years and over | 2,488,590 |
| Management, business, science, and arts occupations | 47.3% |
| Service occupations | 18.0% |
| Sales and office occupations | 26.0% |
| Natural resources, construction, and maintenance occupations | 1.0% |
| Production, transportation, and material moving occupations | 7.7% |
| INDUSTRY | |
| Civilian employed population 16 years and over | 5,135,307 |
| Agriculture, forestry, fishing and hunting, and mining | 1.1% |
| Construction | 7.2% |
| Manufacturing | 11.7% |
| Wholesale trade | 2.0% |
| Retail trade | 11.3% |
| Transportation and warehousing, and utilities | 5.5% |
| Information | 1.6% |
| Finance and insurance, and real estate and rental and leasing | 7.2% |
| Professional, scientific, and management, and administrative and waste management services | 12.9% |
| Educational services, and health care and social assistance | 22.2% |
| Arts, entertainment, and recreation, and accommodation and food services | 8.3% |
| Other services (except public administration) | 4.9% |
| Public administration | 4.1% |
| CLASS OF WORKER | |
| Civilian employed population 16 years and over | 5,135,307 |
| Private wage and salary workers | 80.6% |
| Government workers | 13.5% |
| Self-employed workers in own not incorporated business | 5.8% |
| Unpaid family workers | 0.2% |
| INCOME IN THE PAST 12 MONTHS (IN 2022 INFLATION-ADJUSTED DOLLARS) | |
| Households | 4,299,266 |
| Median household income (dollars) | 67,481 |
| With earnings | 76.7% |
| Mean earnings (dollars) | 96,470 |
| With Social Security income | 31.8% |
| Mean Social Security income (dollars) | 22,539 |
| With Supplemental Security Income | 4.7% |
| Mean Supplemental Security Income (dollars) | 10,492 |
| With cash public assistance income | 1.6% |
| Mean cash public assistance income (dollars) | 3,315 |
| With retirement income | 24.5% |
| Mean retirement income (dollars) | 28,316 |
| With Food Stamp/SNAP benefits | 13.4% |
| Families | 2,785,497 |
| Median family income (dollars) | 83,448 |
| Married-couple family | 73.9% |
| Median income (dollars) | 99,793 |
| Male householder, no spouse present, family | 6.8% |
| Median income (dollars) | 56,963 |
| Female householder, no husband present, family | 19.4% |
| Median income (dollars) | 43,242 |
| Individuals | 10,698,973 |
| Per capita income (dollars) | 38,701 |
| With earnings for full-time, year-round workers: | |
| Male | 2,175,288 |
| Female | 1,711,122 |
| Mean earnings (dollars) for full-time, year-round workers: | |
| Male | 80,257 |
| Female | 61,140 |
| Median earnings (dollars) full-time, year-round workers: | |
| Male | 55,156 |
| Female | 47,092 |
| HEALTH INSURANCE COVERAGE | |
| Civilian noninstitutionalized population | 10,480,843 |
| With private health insurance | 67.8% |
| With public coverage | 35.9% |
| No health insurance coverage | 9.3% |
| POVERTY RATES FOR FAMILIES AND PEOPLE FOR WHOM POVERTY STATUS IS DETERMINED | |
| All families | 9.3% |
| With related children of the householder under 18 years | 14.6% |
| With related children of the householder under 5 years only | 12.7% |
| Married-couple family | 4.5% |
| With related children of the householder under 18 years | 5.6% |
| With related children of the householder under 5 years only | 4.2% |
| Female householder, no spouse present, family | 26.3% |
| With related children of the householder under 18 years | 35.1% |
| With related children of the householder under 5 years only | 36.5% |
| All people | 12.8% |
| Under 18 years | 17.2% |
| Related children of the householder under 18 years | 16.9% |
| Related children of the householder under 5 years | 18.3% |
| Related children of the householder 5 to 17 years | 16.4% |
| 18 years and over | 11.5% |
| 18 to 64 years | 11.7% |
| 65 years and over | 10.9% |
| People in families | 10.1% |
| Unrelated individuals 15 years and over | 23.7% |
| HOUSING TENURE | |
| Occupied housing units | 4,299,266 |
| Owner-occupied housing units | 66.7% |
| Renter-occupied housing units | 33.3% |
| Average household size of owner-occupied unit | 2.53 |
| Average household size of renter-occupied unit | 2.20 |
| UNITS IN STRUCTURE | |
| Occupied housing units | 4,299,266 |
| 1-unit, detached or attached | 71.4% |
| 2 to 4 units | 4.6% |
| 5 or more units | 13.5% |
| Mobile home, boat, RV, van, etc. | 10.5% |
| YEAR STRUCTURE BUILT | |
| Occupied housing units | 4,299,266 |
| Built 2020 or later | 2.9% |
| Built 2010 to 2019 | 15.3% |
| Built 2000 to 2009 | 19.4% |
| Built 1980 to 1999 | 30.0% |
| Built 1960 to 1979 | 19.4% |
| Built 1940 to 1959 | 8.7% |
| Built 1939 or earlier | 4.4% |
| VEHICLES AVAILABLE | |
| Occupied housing units | 4,299,266 |
| None | 5.0% |
| 1 or more | 95.0% |
| HOUSE HEATING FUEL | |
| Occupied housing units | 4,299,266 |
| Gas | 30.3% |
| Electricity | 65.7% |
| All other fuels | 3.4% |
| No fuel used | 0.6% |
| SELECTED CHARACTERISTICS | |
| Occupied housing units | 4,299,266 |
| No telephone service available | 0.9% |
| 1.01 or more occupants per room | 2.3% |
| SELECTED MONTHLY OWNER COSTS AS A PERCENTAGE OF HOUSEHOLD INCOME IN THE PAST 12 MONTHS | |
| Housing units with a mortgage (excluding units where SMOC cannot be computed) | 1,770,630 |
| Less than 30 percent | 76.3% |
| 30 percent or more | 23.7% |
| OWNER CHARACTERISTICS | |
| Owner-occupied housing units | 2,868,467 |
| Median value (dollars) | 280,600 |
| Median selected monthly owner costs with a mortgage (dollars) | 1,444 |
| Median selected monthly owner costs without a mortgage (dollars) | 444 |
| GROSS RENT AS A PERCENTAGE OF HOUSEHOLD INCOME IN THE PAST 12 MONTHS | |
| Occupied units paying rent (excluding units where GRAPI cannot be computed) | 1,300,902 |
| Less than 30 percent | 51.6% |
| 30 percent or more | 48.4% |
| GROSS RENT | |
| Occupied units paying rent | 1,331,663 |
| Median gross rent (dollars) | 1,131 |
| COMPUTERS AND INTERNET USE | |
| Total households | 4,299,266 |
| With a computer | 95.4% |
| With a broadband Internet subscription | 90.2% |
Source: U.S. Census Bureau, 2022 American Community Survey 1-Year Estimates